Winning Back the Mineral Value
South Africa's minerals, from ore to finished product, and the conditions that decide where the value is made
This report asks where South Africa loses value between the mine and the finished product, what stops that value being kept at home, and which mineral commodities can realistically be won back. It is a domestic study built only on public data. Part I sets out what is at stake: jobs lost, value exported raw and processing capacity closed. Part II examines the constraints common to every commodity: electricity, logistics, feed, scale and customers, exploration, skills, enabling inputs, and finance, rights and regulation. Part III assesses nineteen commodities, from chrome to cobalt and graphite, project by project. Part IV sets out the McKallip proposition, what each actor must do and the next twelve months.
- Author
- Victor Mkhaliphi
- Published
- 11 October 2026
- Format
- Online reader + PDF

A clear sequence from evidence to decision
What the report argues
- 01
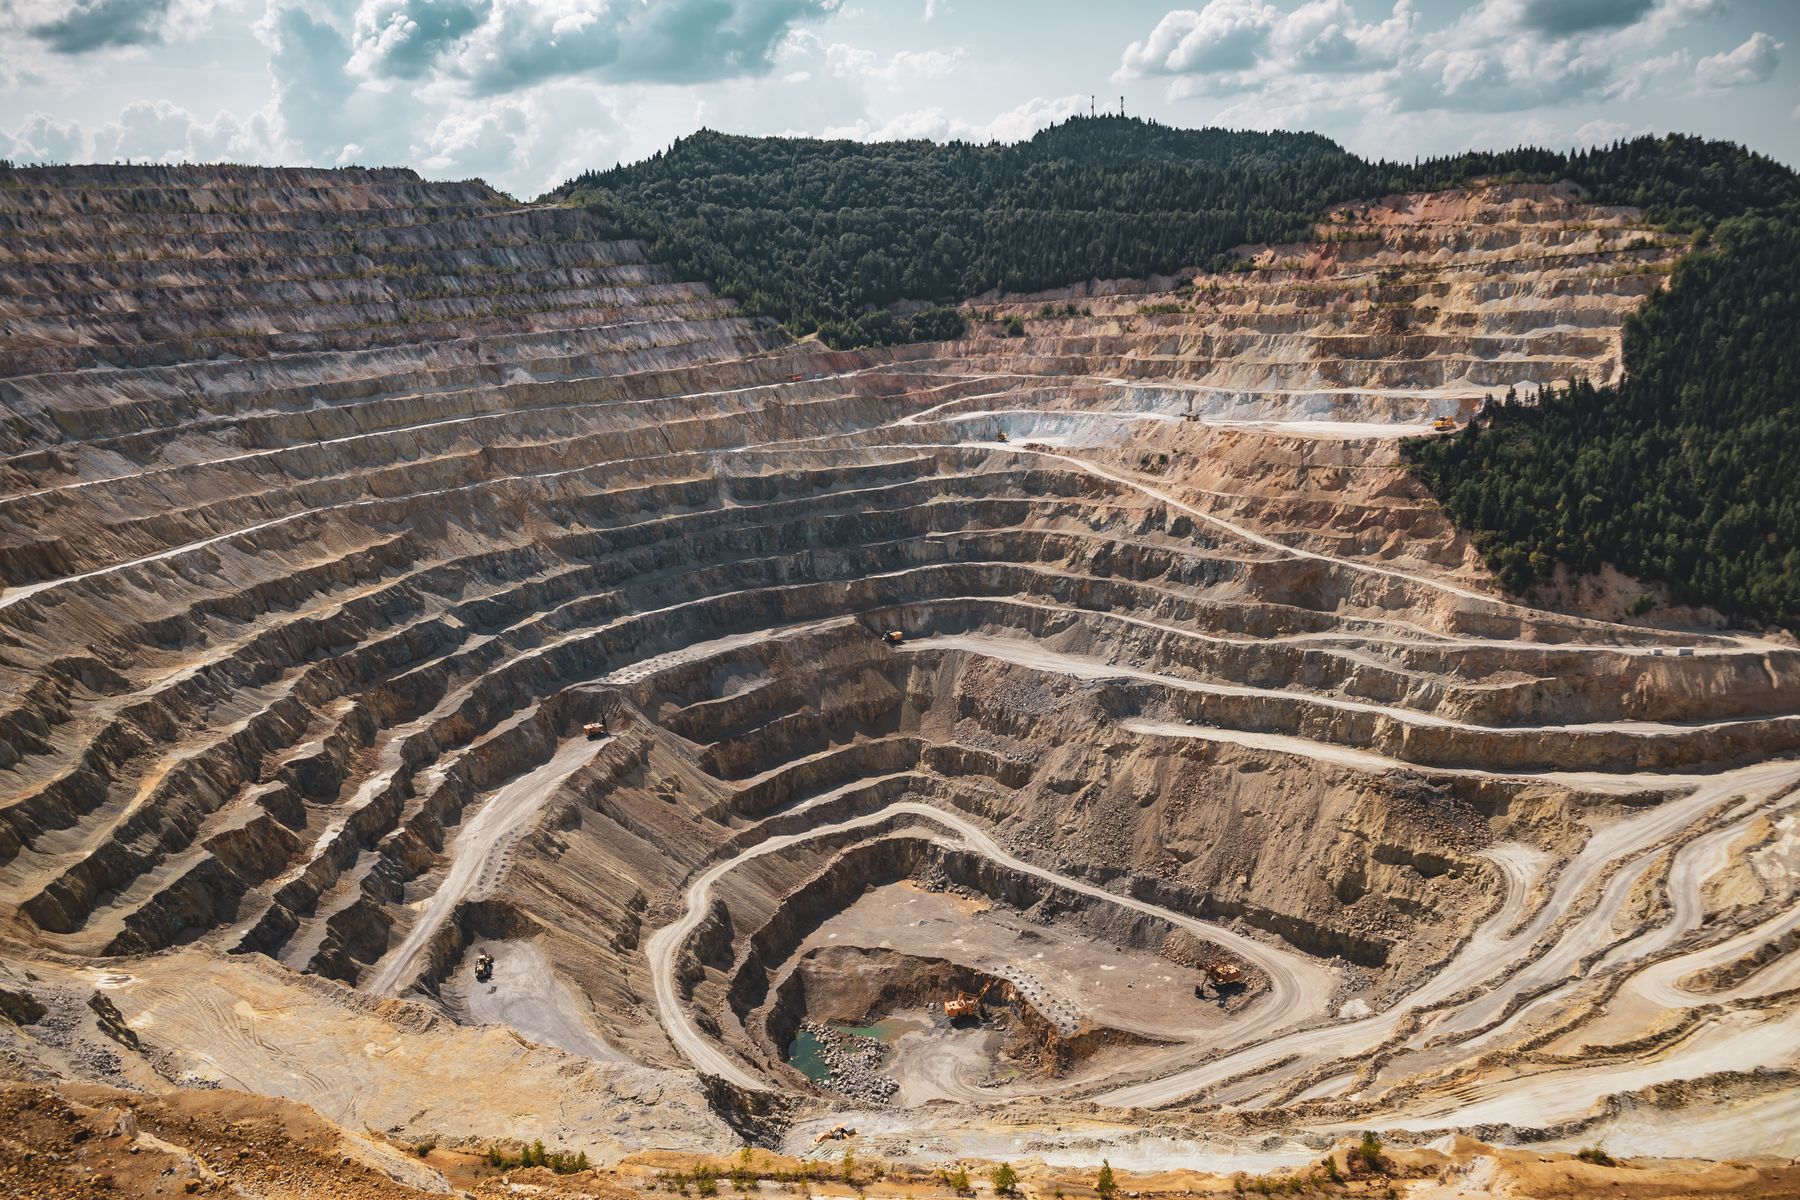
Value is leaking, and faster. In 2025, 57% of export value across eleven mineral commodities left as ore or concentrate. Chrome ore exports rose from US$1.1bn to US$5.2bn while ferrochrome exports halved in 2025 alone, to US$1.8bn (chapter 2). (Observed.)
- 02
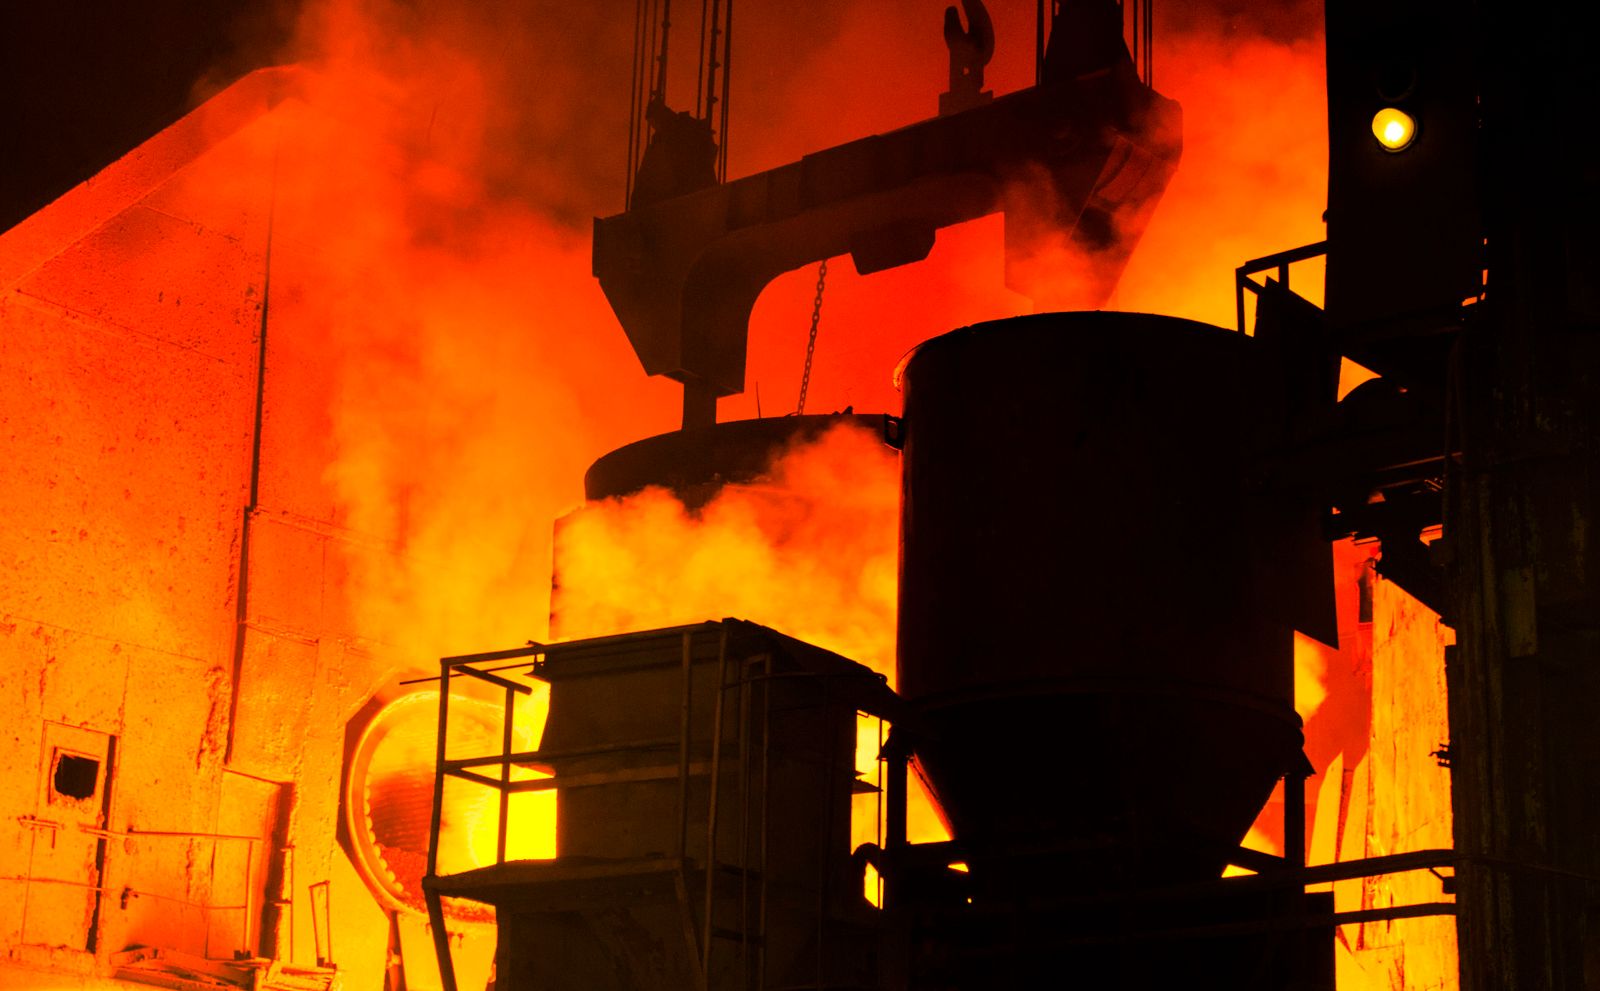
Plants are idle for want of conditions, not for want of plants. About 2.7 Mt a year of intact capacity stands idle beyond the restarting ferrochrome fleet, and about 1.5 Mt is gone for good. When one negotiated power tariff arrived in 2026, idle ferrochrome furnaces restarted within weeks, and about 3,730 jobs are being recovered (chapters 3 and 12). (Observed.)
- 03
Each condition binds a different step. Power decides which bulk smelters run: the average Eskom price rose from 19.8c to 188.0c a kilowatt-hour between 2007/08 and 2024/25. Rail and ports decide how much leaves: Transnet's rail volume fell from 226 Mt to 168 Mt. Scale and customers decide what new plants can be built (chapters 5, 6 and 7). (Observed.)
Ferrochrome Competitiveness and the Power Cost Curve
How tariff exposure, furnace utilisation and contracting choices shape South African ferrochrome competitiveness.
- Scoping
- 2Research
- 3Review
- 4Release
Be the first to know when it publishes
Evidence you can trace
Every report carries its methodology and a source register, so claims can be checked, not just read.
Read it your way
Open the report in your browser or download the PDF. Both are in your account library the moment you buy.
Built for decisions
Written for policymakers, operators and investors weighing where South African minerals can capture more value.
Start with the weekly analysis
Why beneficiation policy fails when it treats every mineral the same
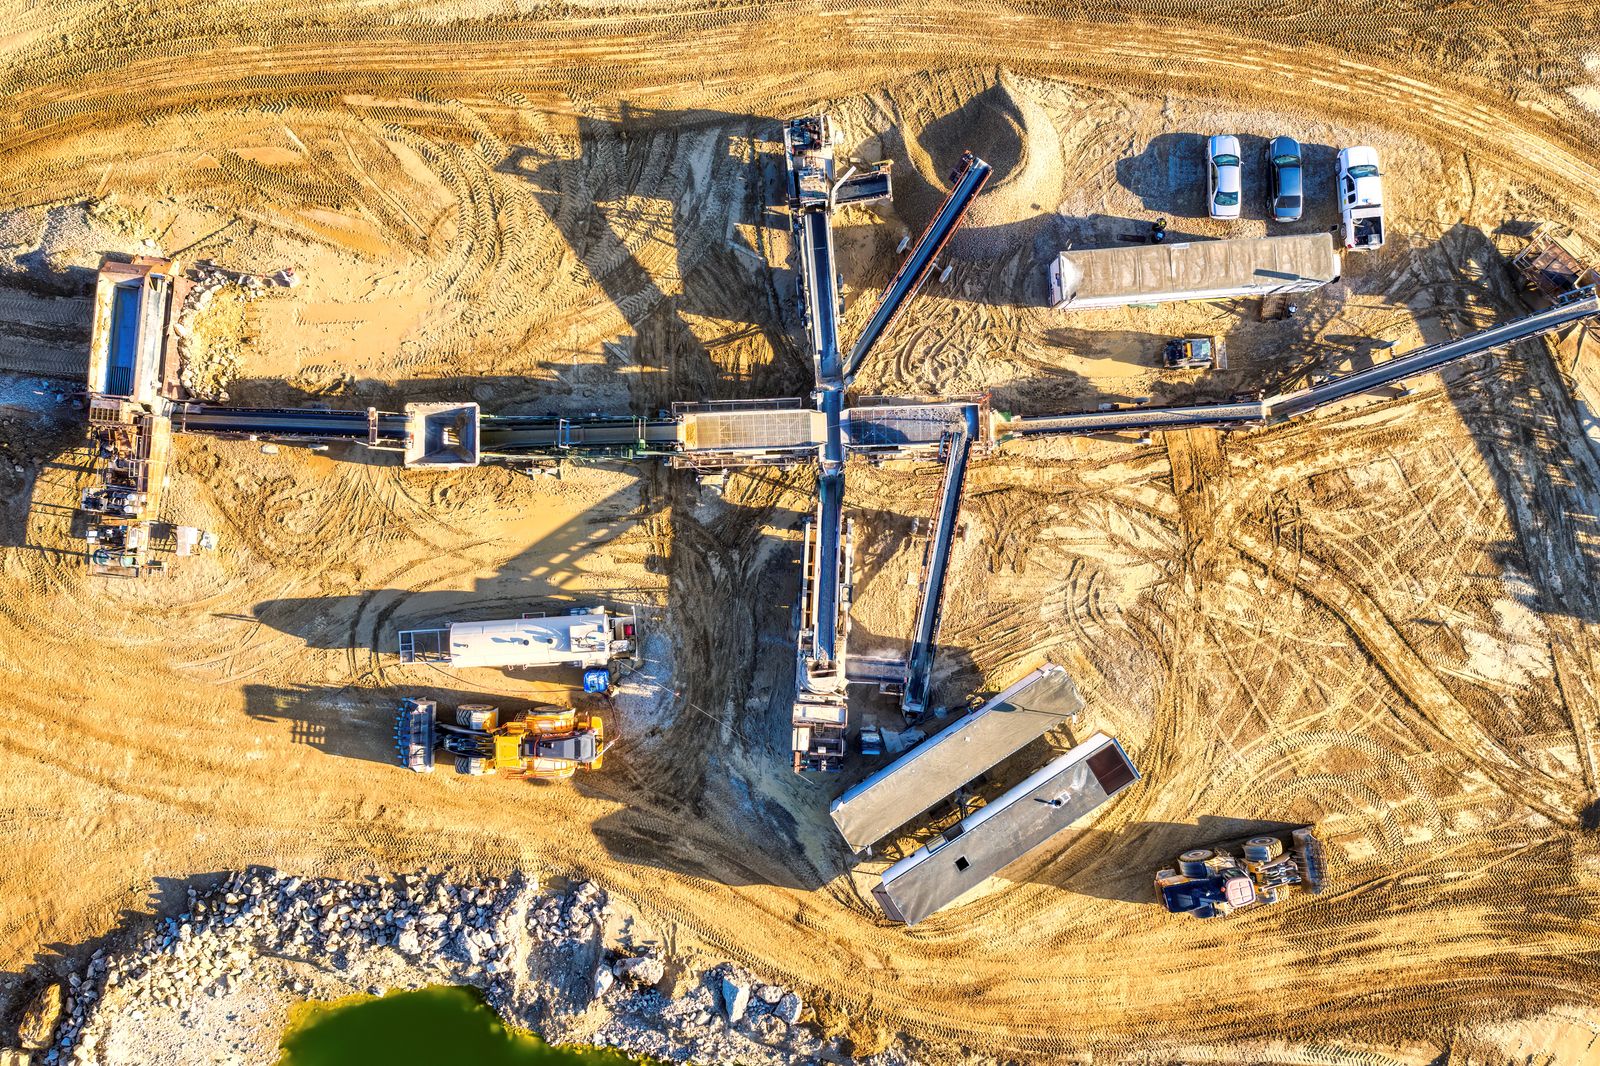
South Africa's beneficiation mandate applies a uniform logic to commodities with fundamentally different metallurgy, market structures, capital requirements and competitive positions.
South Africa's ferrochrome problem is an electricity problem
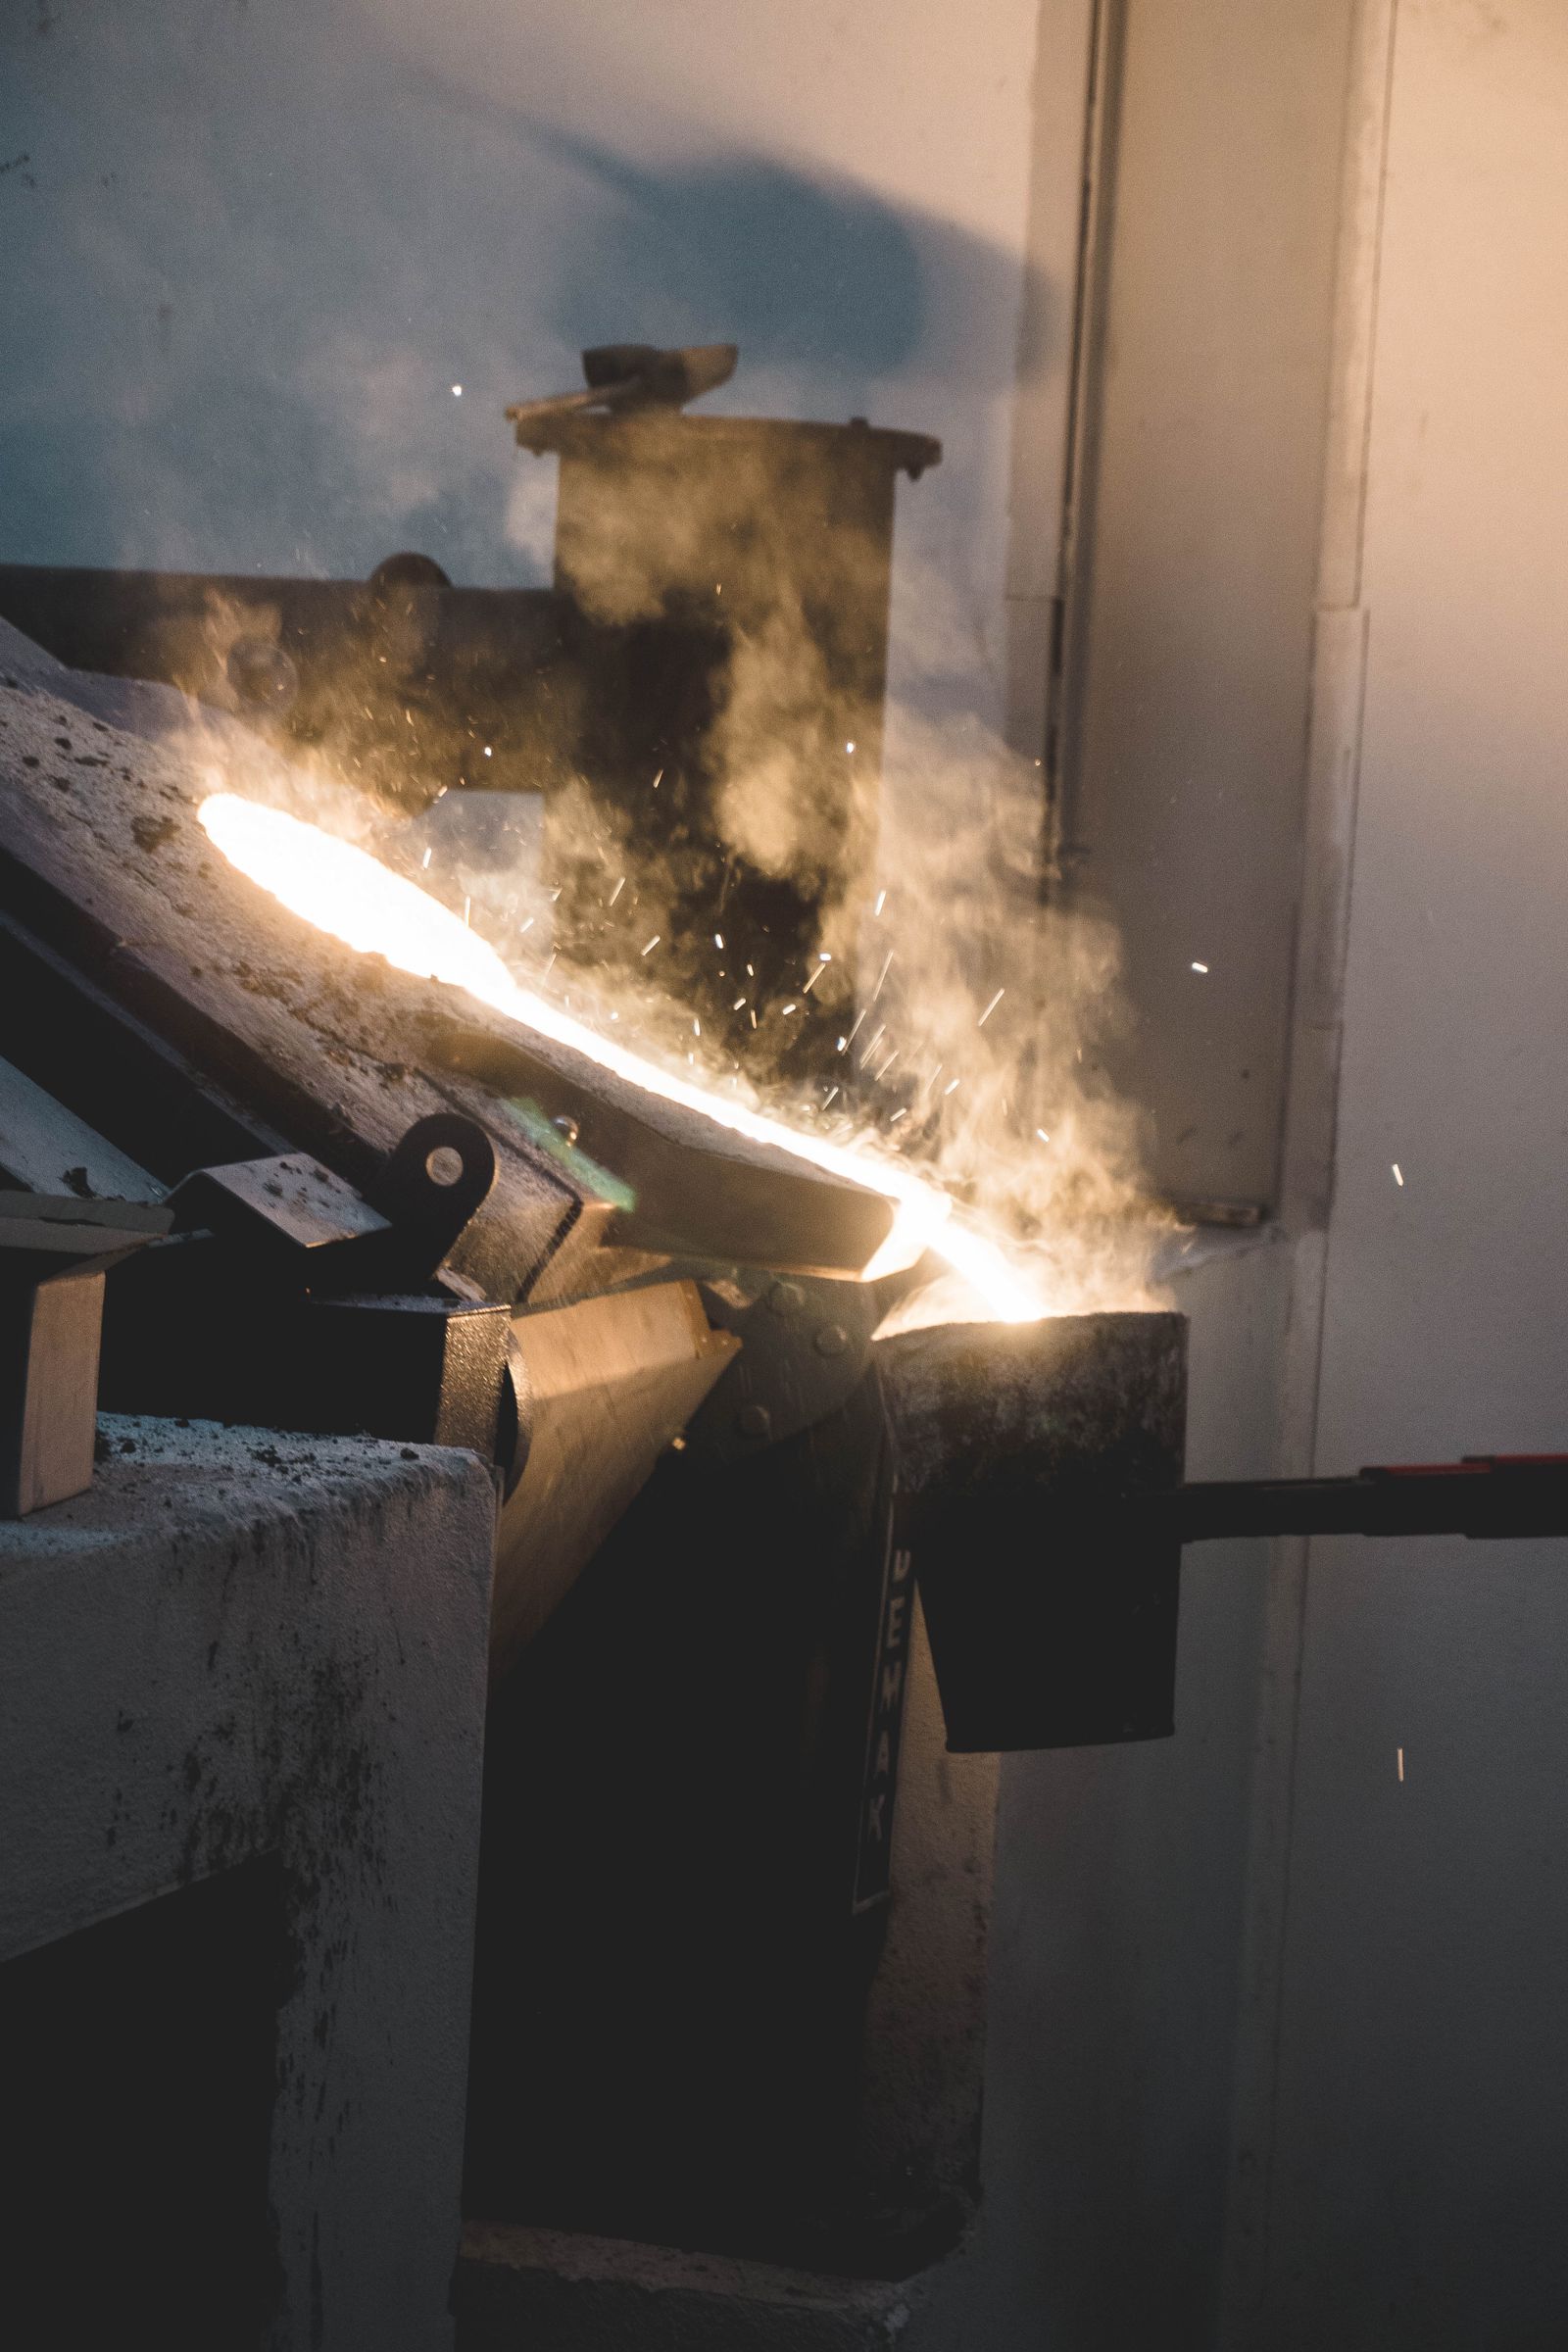
Ferrochrome smelting remains structurally competitive only when tariff trajectories, reliability, and furnace utilization are modeled together rather than separately.
Four rare-earth feedstocks that do not require a new mine
Several African rare-earth opportunities derive from existing operations and waste streams rather than greenfield mine builds.
Browse by commodity
Free analysis, sample chapters and report alerts.
Create a free account to read every weekly analysis and buy reports in a couple of clicks.